Corruption and wealth
Over at A Fistful of Euros, Doug Muir wrote about the newest corruption perception index numbers from Transparency International. As Doug points out, the numbers are perceptive, and not necessarily a real picture of the level of corruption in the country.
Doug also wrote the following:
Someone of course went ahead and did it, and put the result up on the web. As people can see, there is a fairly strong correlation between the CPI and GDP per capita.
I couldn't help wonder if there would be any correlation with the GINI coefficient and the CPI. Intuitively, it would seem logical, but we all know that intuition often is wrong.
So, I did some number crunching, looking at the CPI, GDP per capita, and the GINI coefficient. As the CIA factbook doesn't have the GINI coefficient for a number of countries (including most Arabic countries), the results are of course more limited than the straight CPI/GDP per capita comparison. However, I did find some interesting results.
There is apparently absolutely no correlation between the GINI coefficient and the CPI score.

As I said, intuitively it would seem that there would be some kind of correlation, but it doesn't seem to be the case if you go but the numbers. Countries with high CPI numbers (i.e. countries that are less corrupt) tend to have lower GINI scores that other countries, but Singapore (4th highest CPI) stands out among the top ten.
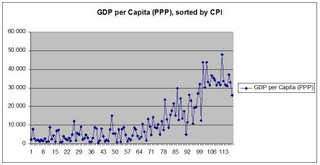
As Doug said, there were some outliers when you look at the CPI and the GDP per capita (PPP). First I looked at PPP sorted by CPI (again only with countries that I had the GINI score for).
 In the bottom end of the CPI scale, Belarus is an outlier - not really surprising, as is Turkmenistan.
Russia stands out as the one country in the lower half with a PPP of more than $10,000. Jordan is a huge out lier, with the highest CPI of any country with a PPP below $5,000. Chile is also noteworthy by having the same CPI as the US though the difference in PPP is $30,900 (Chile: $12,600, USA: $43,500).
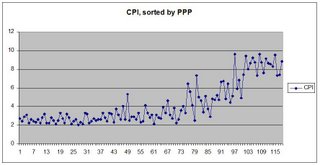
I also looked at the CPI sorted by PPP.

Here the noteworthy exception is New Zealand, and to some degree Italy, the US and Ireland - all in the high end. The rest of the abnormalities were uncovered by the other graph.
Doug also wrote the following:
You know what I’d love to see? I’d love to see some scattergraphs correlating these scores with things like PPP GDP per capita. You’d see a cloud of dots around a rough diagonal line, with scores tending to rise with income. But there’d be interesting outliers on either side.
Someone of course went ahead and did it, and put the result up on the web. As people can see, there is a fairly strong correlation between the CPI and GDP per capita.
I couldn't help wonder if there would be any correlation with the GINI coefficient and the CPI. Intuitively, it would seem logical, but we all know that intuition often is wrong.
So, I did some number crunching, looking at the CPI, GDP per capita, and the GINI coefficient. As the CIA factbook doesn't have the GINI coefficient for a number of countries (including most Arabic countries), the results are of course more limited than the straight CPI/GDP per capita comparison. However, I did find some interesting results.
There is apparently absolutely no correlation between the GINI coefficient and the CPI score.

As I said, intuitively it would seem that there would be some kind of correlation, but it doesn't seem to be the case if you go but the numbers. Countries with high CPI numbers (i.e. countries that are less corrupt) tend to have lower GINI scores that other countries, but Singapore (4th highest CPI) stands out among the top ten.
As Doug said, there were some outliers when you look at the CPI and the GDP per capita (PPP). First I looked at PPP sorted by CPI (again only with countries that I had the GINI score for).
 In the bottom end of the CPI scale, Belarus is an outlier - not really surprising, as is Turkmenistan.
Russia stands out as the one country in the lower half with a PPP of more than $10,000. Jordan is a huge out lier, with the highest CPI of any country with a PPP below $5,000. Chile is also noteworthy by having the same CPI as the US though the difference in PPP is $30,900 (Chile: $12,600, USA: $43,500).
I also looked at the CPI sorted by PPP.

Here the noteworthy exception is New Zealand, and to some degree Italy, the US and Ireland - all in the high end. The rest of the abnormalities were uncovered by the other graph.
Labels: corruption, social science, transparency international


0 Comments:
Post a Comment
<< Home